Guide
3 min read
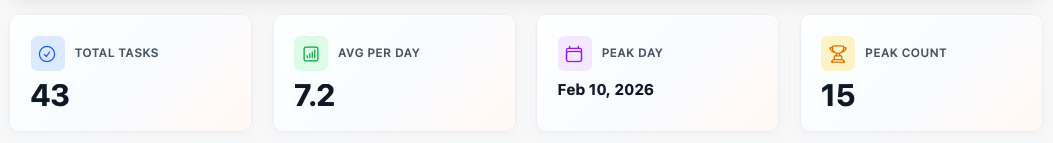
Tracking Throughput
Measure how many tasks your team completes over time and identify trends in delivery velocity.
1
What Is Throughput?
Throughput measures the number of tasks completed within a given time period. It answers the question: "How much work is getting done?"
Higher throughput generally indicates a productive team, but quality matters too — throughput should be considered alongside other metrics.
2
Navigate to Throughput
From the metrics dashboard, click Throughput to see the detailed view. You can also navigate directly from the board by going to Metrics → Throughput.
3
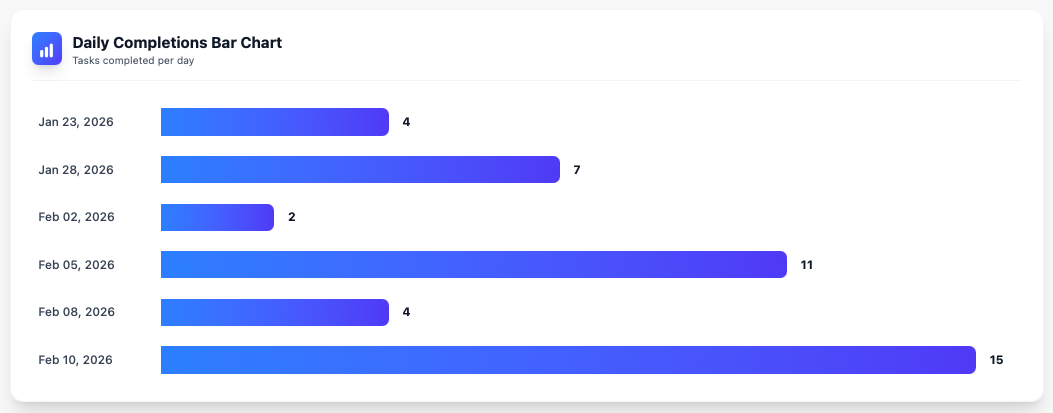
Reading the Chart
The throughput chart shows completed tasks over your selected time range. Look for:
- Upward trends: Team is delivering more over time
- Flat lines: Consistent delivery rate
- Dips: Potential blockers, holidays, or capacity changes
4
Using Throughput Effectively
Throughput is most useful when tracked over time:
- Set a baseline by observing throughput over 30 days
- Watch for sustained drops that may indicate process problems
- Compare throughput before and after process changes
- Use agent-level throughput to balance workload across your team
You're all set!
You've completed all the steps in this guide.