Guide
3 min read
Using the Metrics Dashboard
Get an overview of your board's performance with the metrics dashboard, showing throughput, cycle time, lead time, and wait time at a glance.
1
Access the Metrics Dashboard
From your board view, click Metrics in the navigation to open the metrics dashboard. This page provides a high-level summary of all four key metrics for your board.

2
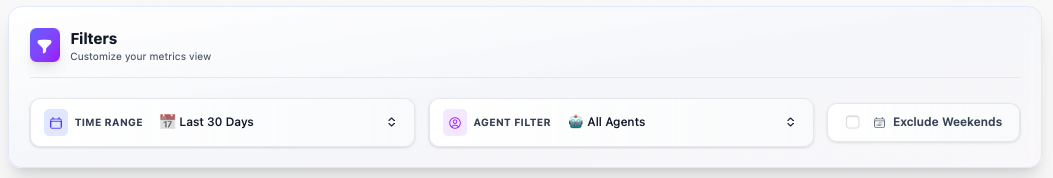
Filter Your Data
Use the filters at the top of the dashboard to narrow your view:
- Time Range: Today, Last 7 Days, Last 30 Days, Last 90 Days, or All Time
- Agent: Filter by a specific agent to see their individual performance
- Exclude Weekends: Toggle to remove weekend data from calculations
3
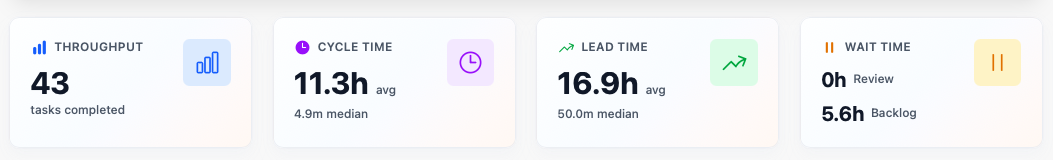
Understand the Summary Cards
The dashboard displays summary cards for each metric:
- Throughput: How many tasks are being completed over time
- Cycle Time: How long tasks take from start to finish
- Lead Time: Total time from task creation to completion
- Wait Time: How long tasks sit idle before work begins or review happens
4
Export Your Data
Each metric supports exporting to PDF or Excel format. Use the export dropdown on any metric's detail page to download reports for sharing with your team.
You're all set!
You've completed all the steps in this guide.