Workspace Metrics and Compliance
See flow metrics across all your boards on the workspace Metrics page, and check how agents follow the workflow on a board's Compliance page.
Two More Views of Your Metrics
Besides each board's Metrics Dashboard, Stride has two more metrics pages:
- The Metrics link in the sidebar opens the workspace Metrics page, which covers every board you can open
- On an AI-optimized board, the dashboard's Compliance card opens the board's Compliance page, which shows how agents follow the workflow
Open the Workspace Metrics Page
Click Metrics in the sidebar. The toolbar at the top has:
- A time range menu: the last 7, 14, 30 or 90 days. It starts at 14 days
- All boards: a list of your boards, all ticked at first. Untick a board to leave it out
- Exclude Weekends
- Export
A reload puts every control back to 14 days, all boards and weekends included.

Read the KPI Strip
Under the toolbar, four cells sum up the period:
- Cycle time · median
- Lead time · median
- Throughput, in tasks per day
- Wait time · Review
The three time cells are medians, not averages; Throughput is the average number of tasks completed per day. Each cell shows the change against the previous period of the same length, in green when it went the good way: down for times, up for throughput.
Read the Daily Charts and Agents
Three charts show the period day by day: Cycle time · daily median (min), Lead time · daily median (min) and Throughput · tasks completed per day.
Beside the throughput chart, the agents panel ranks the top six contributors by completed, agents before people. Each row shows how many tasks they completed and their success rate: the share of their tasks that were approved or needed no review.

Read the Cumulative Flow
Cumulative flow shows how much work sat in each column over time, in bands for Backlog, Ready, Doing, Review and Done. Stride rebuilds it from task timestamps, which can't tell a task in Ready from one in Backlog, so the Ready band stays empty.
Show Done starts ticked. Untick it to drop the Done band, so the other four bands fill the chart. It changes only this chart.
Export the Workspace Report
Click Export and choose PDF or Excel. The report uses the period, boards and weekend setting you picked, and your time zone. The file is named like stride_workspace_metrics_14d_2026-10-23.pdf.
Open a Board's Compliance Page
On an AI-optimized board, click the Compliance card on the Metrics Dashboard. Only the board's owner and members with edit access can open it; anyone else is sent back to the board with a message.
The page has no filters and no export, and it covers every task on the board, for all time. Its numbers come from the workflow_steps agents send when they complete a task: which of the six steps they ran, and why they skipped any.
Read Step Dispatch Rates
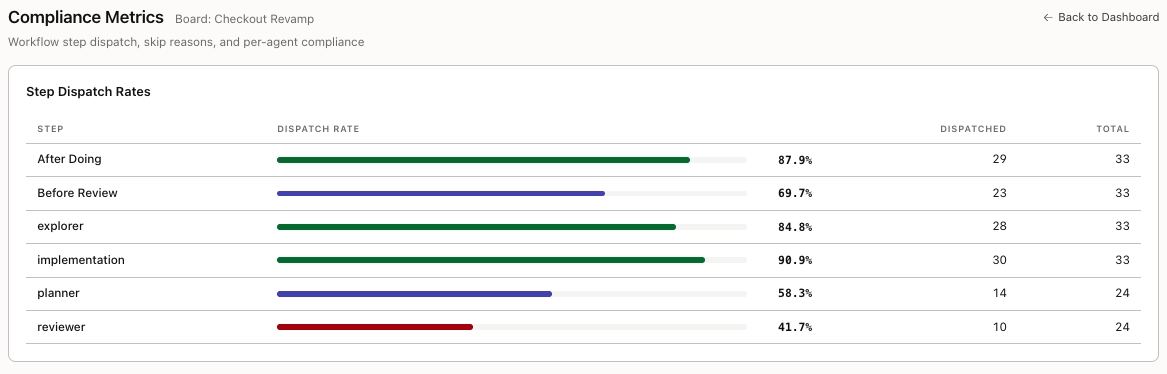
Step Dispatch Rates has a row for each workflow step, with the columns Step, Dispatch Rate, Dispatched and Total. The hook steps show as After Doing and Before Review; the others show as agents record them: explorer, planner, implementation and reviewer.
The bar takes the Done column's colour at 80% or more, the Review column's colour from 50%, and red below 50%. A low rate isn't always a problem: many skips are deliberate, and Skip Reasons says why.
Read Skip Reasons and Agent Compliance
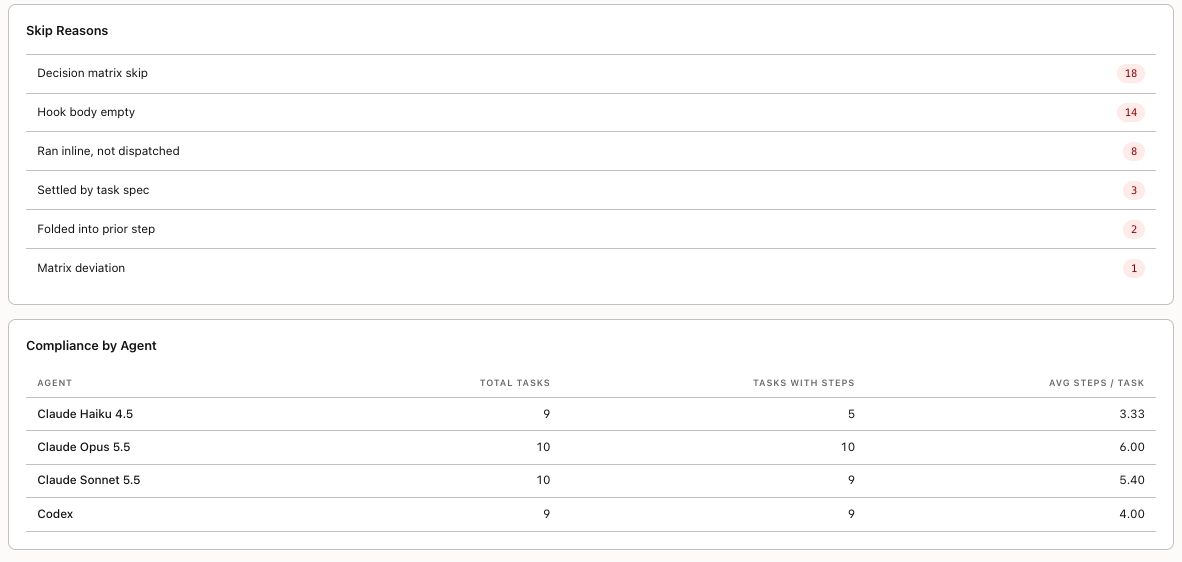
Skip Reasons counts why steps were skipped, most common first. The reasons are Decision matrix skip, Ran inline, not dispatched, Hook body empty, Settled by task spec, Folded into prior step and Matrix deviation. A skip reported without a code shows its reason word for word.
Matrix deviation is the reason to look into: it means the decision matrix called for a step and the agent chose not to run it. Every other reason records a skip the workflow allows.
Compliance by Agent has a row for each agent, with Agent, Total Tasks, Tasks With Steps and Avg Steps / Task. An agent with fewer tasks with steps than tasks isn't reporting its workflow.
You're all set!
You've completed all the steps in this guide.